
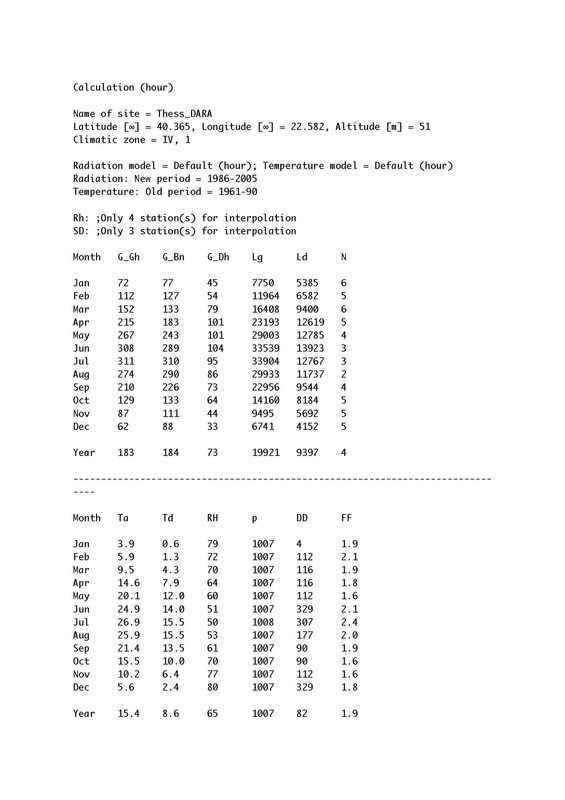
SOURCE: meteonorm
Latitude: 40.365, Longitude: 22.582, Altitude: 51m
Radiation: New period: 1986-2005
Temperature: [Old period: 1961-1990] & [New Period 2000-2009]

|


|
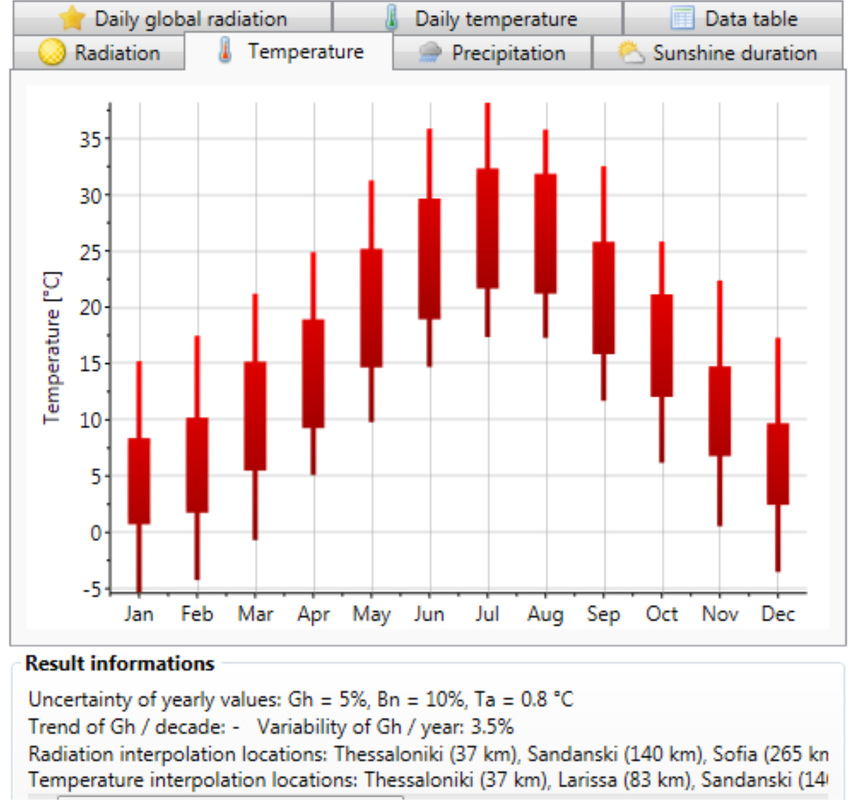
TEMPERATURE (°C)

|
|
|
Temperature: Old period: 1961-1990
|
Temperature: New period: 2000-2009
|
The temperature ranges shown here per month are quite broad. The variation shown here on average varies from the graph shown in Climate consultant
It should be noted that the temperatures however remain on average: highs of 33°C in July and lows of 1°C in January
It should be noted that the temperatures however remain on average: highs of 33°C in July and lows of 1°C in January
DAILY TEMPERATURE (°C)

|

|
|
Old period: 1961-1990
|
New period: 2000-2009
|
RADIATION (kWh/m²)

Despite the unit variation between this graph and that shown in the Climate Consultant readings, there is a similarity in the peak of Global radiation in July, with high ranges of global radiation between june and August.
The lower ranges are in the months between November-February.
The Diffuse radiation is steady in the months between April-August, here begins a drop in diffuce radiation.
This could be influenced by the cloud coverage shown in the Climate Consultant graph.
The lower ranges are in the months between November-February.
The Diffuse radiation is steady in the months between April-August, here begins a drop in diffuce radiation.
This could be influenced by the cloud coverage shown in the Climate Consultant graph.
DAILY GLOBAL RADIATION (kWh/m²)

SUNSHINE DURATION

The Summer months June - September: sun duration : 7-11 hours per day.
The winter months November - March: sun duration: 3-5 hours per day
The winter months November - March: sun duration: 3-5 hours per day
PRECIPITATION (mm)

|

|
|
Old period: 1961-1990
|
New period: 2000-2009
|
October - December shows the highest level of precipitation
With June - October showing lowest level of precipitation
There is a variation between the old period records of precipitation and the new period. It appears that there was a huge drop in February between 2000-2009 and again a contrast in November On the whole the average number of days with precipitation is similar between the two records.
